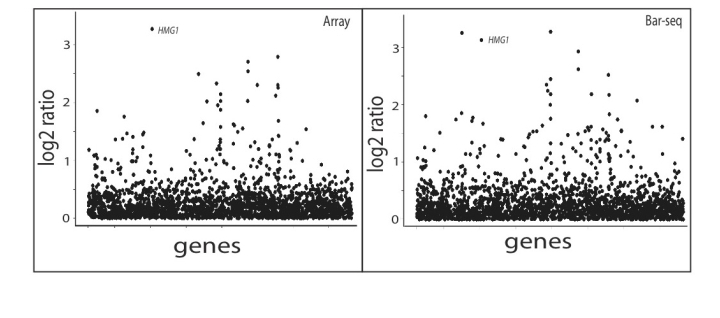
FigS2 : Fitness Profiles for Cerivastatin
These plots show the log2 fitness-defect ratio (control/treatment) for one experiment assessed in the 20-plex Bar-seq run or by microarray. Ratios are ordered across the x-axis by gene deletion. The profiles are from a 6uM cerivastatin treatment, on of our positive controls. The data has been filtered to exclude strains with signal in the control condition that did not exceed an arbitrary threshold (microarray signal intensity: 200, Bar-seq counts: 40)
